A new paper has been published within Science Advances that lays out new estimates of the heat content within the worlds oceans. It is entitled “Improved estimates of ocean heat content from 1960 to 2015“.
Background
Now before we get into it, let’s cover the basics.
We have more carbon dioxide in our atmosphere, and that is increasing each and every year. Carbon Dioxide is a greenhouse gas, so increasing it will result in more heat being trapped. About 90% of this extra heat lands up in the ocean and so measuring what is happening in our oceans is one way of measuring what is going on.
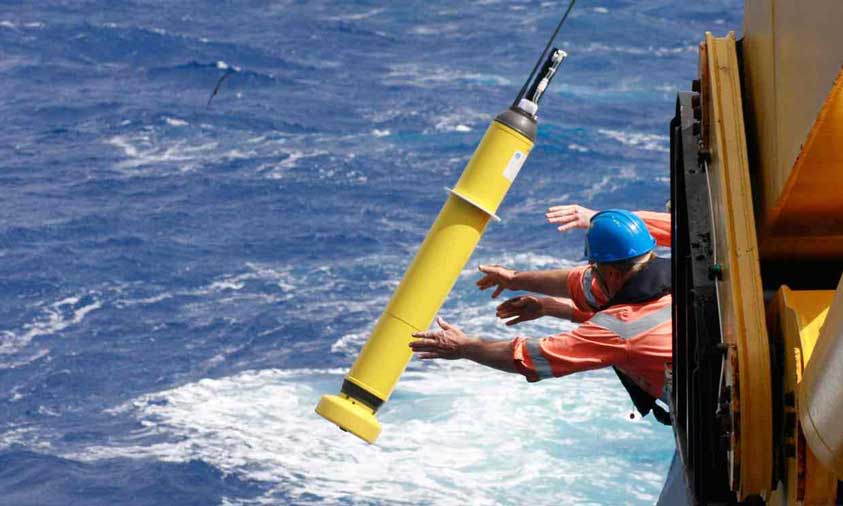
We do have data, lots and lots of data. Starting in the early 2000’s Argo measurement devices have been deployed. These floats get dropped into the ocean, and so far there are almost 4,000 of them. They are designed to sink down to about 2,000 meters, then rise to the surface measuring temperature, salinity, and currents. Once they break surface, they then transmit all the data gathered, then sink back to about 1,000 meters and park there ready for the next 10 day cycle.
One very special interest is the Ocean Heat Content (OHC). Ocean heat content does play a role in sea level rise due to what is known as thermal expansion. (Heat up water and the water molecules tend to move more and so maintain a greater separation).
What Does the paper do?
Via Argo a very precise almost real-time measurement is now possible, and so using that new understanding it is possible to take historical data and correct it.
The published paper has done just that, and so one of the paper’s authors explains it as follows …
First, we corrected past data for known biases in measurements. Second, we related the temperature measurements to results calculated from advanced climate computer models. Third, we applied temperature knowledge to larger areas so that a single measurement was representative of a large space around the measurement site. Finally, we used their knowledge of recent and well-observed temperatures to show that the method produced excellent results.
We were able to extend our techniques back to the late1950s and show that the rate of global warming has changed significantly in the past 60 years. One main outcome of the study is that it shows we are warming about 13% faster than we previously thought. Not only that but the warming has accelerated. The warming rate from 1992 is almost twice as great as the warming rate from 1960. Moreover, it is only since about 1990 that the warming has penetrated to depths below about 700 meters.
How do such changes impact us?
Warmer oceans, along with more warm moist air above the oceans will feed into storm systems. The net effect will be more intense storms and also more rainfall.
Commentary From those that wrote the paper
The lead author, Lijing Cheng explains …
We know that ocean observations were very sparse until the Argo era. There were major gaps in data, particularly in the Southern Hemisphere. Our challenge was to assess the changes to global ocean heat and fill data gaps. A major issue is to ensure gap-filling is reliable. It is this issue that motivated the study. We proposed an advance gap-filling strategy and used it to attain near global coverage. We rigorously evaluated the reliability of our approach and as a result, we have much higher confidence that the ocean and the Earth are warming at a faster rate than previously thought.
John Fasullo, one of the co-authors, also adds his thoughts …
This study shows that more heat is likely to have been absorbed by the oceans over the past 50 years than had previously been reported. With upward revisions in our estimates of the climate’s sensitivity to greenhouse gases and the associated resultant sea level rise.
They have a formal press release …
we know the oceans are much warmer now and they contain the memory of climate change. Higher sea surface temperatures are continually reinforced by the extra heat beneath the ocean surface. The oceans are affecting weather and climate through more intense rains. This process is a major reason why 2016 was the hottest year ever recorded at the Earth’s surface, beating out 2015 which was the previous record. Additionally 2015 was a year with record hurricanes, heat waves, droughts, and wild-fires around the world.