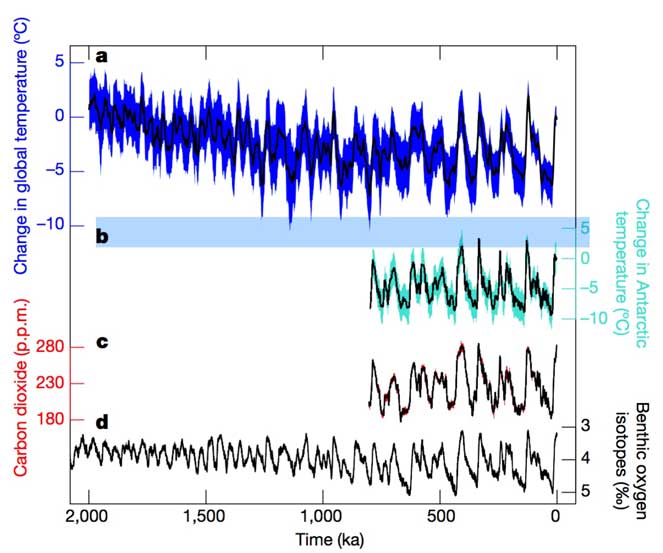
 A new and quite impressive paper has been published in Nature that lays out about two million years of climate history. What has happened in the past is a rather obviously valuable tool because it also enables us to understand the future we face. Prior to this specific paper only small windows of specific periods had been constructed. Nobody had previously composed a continuous reconstruction that spanned right across the various glacial periods and spanned an impressive two million years.
The paper entitled “Evolution of global temperature over the past two million years” was finally published a few days ago in Nature.
Side Note: Unfortunately it is behind a paywall, so I’m afraid you will need to pay $32 to access it if you don’t have an academic account. There are of course some naughty alternatives, but you should simply not leverage any of those. Under no circumstances should you go to http://sci-hub.bz, and if you should happen to do that accidentally, then you should not key the title in there and download a free copy. Remember, if you don’t pay that fee then you are depriving the paper’s author of exactly nothing because she does not get paid for being published in Nature, and you are also depriving the peer-reviewers of exactly nothing because that also do not get paid by Nature.
Data Source?
Carolyn Snyder, the sole author of this paper, collected 20,000 reconstructions of sea surface temperature from the last 2 million years of Earth history and put them all together into one continuous story that lays out the climate variations over the past 2 million years.
Reconstruction of global average surface temperature (GAST)
OK, so here is the summary chart for the past 2 million years. The big lesson here is the clearly defined manner in which the GAST temperature responds to the quantity of carbon dioxide in the atmosphere …
The above chart is a reconstruction of global average surface temperature (GAST) over the past 2 million years compared to other key palaeoclimate variables. Looking at the above and working top down …
- First comes in blue the GAST as temperature deviation (in °C) from present (average over 0–5 ka)
- Next is a stacked reconstruction of change in Antarctic temperature14 (°C) in cyan
- Then you have a stacked reconstruction of atmospheric CO2 concentrations18 (p.p.m.) in red (the scale is in red on the left, the actual measurements are black)
- Finally at the bottom. you have a stack of deep-sea oxygen isotopes, delta-O-18 (‰), in grey.
You might be wondering about that last one, the delta-O-18 measurements. That is a paleoclimatology way of working out temperatures from extracts of corals, foraminifera and ice cores. The ratio of 18O to 16O in the sample is used to indirectly determine the temperature of the surrounding water at the time the sample was formed. (See here for more details on this).
The key message that is delivered by this paper is this rather stark warning …
stabilization at today’s greenhouse gas levels may already commit Earth to an eventual total warming of 5 degrees Celsius (range 3 to 7 degrees Celsius, 95 per cent credible interval) over the next few millennia as ice sheets, vegetation and atmospheric dust continue to respond to global warming.
One further point. The GAST reconstruction is estimated independently of the ice core records from the Antarctic, and yet as can be seen above, they are highly correlated and do indeed align.
So is it true, is this evidence that what has already happened will lead to a greatly warmed planet?
There is a conversation (The skeptical bit)
Next comes a conversation within the community and so as you might expect, some are popping up and saying, “No this is not right because …”. There is a National Geographic article that now covers that reaction …
“This is simply wrong,” said Gavin Schmidt, chief of NASA’s Goddard Institute for Space Studies.
Jeffrey Severinghaus, a paleoclimatologist at Scripps Institution for Oceanography in San Diego, was equally vehement, arguing that the study’s result isn’t logical: “It’s based on a fundamental mistake,” he said. “The problematic conclusion doesn’t flow from the main meat of the paper.”
… and they explain why …
Her mistake, the critics said, was in the simplistic way she used that correlation to infer the Earth’s sensitivity to CO2—not only in the past but also in the future. Her conclusions simply didn’t make sense, they said. The reason is that much of the variation in temperature during the ice ages was caused by factors other than CO2.
Over the past 800,000 years, massive ice sheets have expanded across the northern continents and then retreated again every 100,00 years or so. The cycle is driven by variations in Earth’s orbit about the sun, which determine whether enough sunlight falls on the Northern Hemisphere in summer to melt ice.
The presence of ice itself has a dramatic cooling effect on the planet, because it reflects sunlight back to space. Conversely, when ice melts at the end of a glacial period, the increased absorption of sunlight warms the whole planet—triggering feedback effects, including a rise in CO2, that warm it further.
So the paper is all wrong then?
Nope, the data itself is wholly valid and really did need to be done. It is not the data they are objecting to, simply the conclusion that CO2 has always been the prime cause and not simply a correlation.
The author of the paper agrees with that because over the weekend she wrote a blog post to explain why the relationship between CO2 and temperature during the ice ages isn’t enough by itself to describe our potential future. There she explains why that is the case and concludes …
you can’t estimate Earth System Sensitivity solely from correlations over ice age cycles, no matter how well put together the temperature data set is.
In summary, the data is valuable and useful, but is just a correlation. The question regarding the future remains open, and as noted, within the National Geographic article … .
once all the feedbacks have had a chance to kick in, the warming could be indeed be substantially larger than in the short term.
