The International Energy Agency (IEA) has issued a report that highlights the ongoing rise in CO2 within our atmosphere. As reported by Reuters …
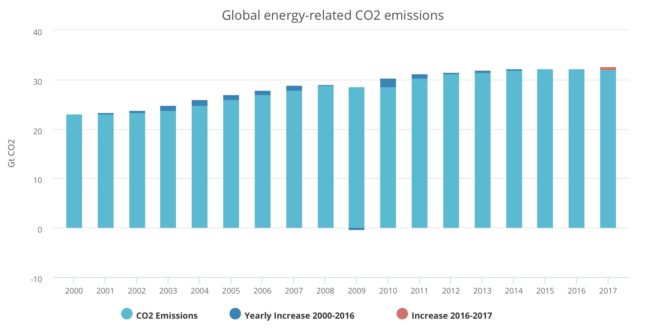
Global energy-related carbon emissions rose to a historic high of 32.5 gigatons last year, after three years of being flat, due to higher energy demand and the slowing of energy efficiency improvements, the International Energy Agency (IEA) said.
Global energy demand rose by 2.1 percent last year to 14,050 million tonnes of oil equivalent, more than twice the previous year’s rate, boosted by strong economic growth, according to preliminary estimates from the IEA.
Energy demand rose by 0.9 percent in 2016 and 0.9 percent on average over the previous five years.
Over 70 percent of global energy demand growth was met by oil, natural gas and coal, while renewables accounted for almost all of the rest, the IEA said in a report.
Improvements in energy efficiency slowed last year. As a result of these trends, global energy-related carbon dioxide emissions increased by 1.4 percent in 2017 to 32.5 gigatons, a record high.
What is the Alpha Source for this?
The Alpha source is the IEA report itself.
You can find the full report here (pdf)
In essence, it provides a snapshot of recent global trends and developments across fuels, renewable sources, energy efficiency, and carbon emissions, in 2017.
What has gone wrong?
There has supposedly been a huge increase in renewables, and so if that is correct, then how is this increase in CO2 possible?
The rise in the use of renewables is quite real and also measurable. In the US CO2 emissions are down 0.5 percent to 4.8 gigatons due to higher renewables deployment. In the UK, Mexico, and also Japan there have been CO2 declines as well. The problem has been the rest of the world. Overall, oil demand increased by 1.6 percent, Natural gas consumption rose by 3 percent, and coal demand has increased by 1 percent.
While renewables did rise by 6.3 percent and so met about a quarter of the increased demand of growth, it was not enough to offset the rise in other sources and so the overall levels of CO2 emissions have risen.
Here is the growth of CO2 since 2000

Several flat years, and then the increase in 2017.
Who is on the Naughty List?
Basically everybody except the US, the UK, Mexico, and Japan.
Now What?
All is not lost …
The IEA’s Sustainable Development Scenario charts a path towards meeting long-term climate goals. Under this scenario, global emissions need to peak soon and decline steeply to 2020; this decline will now need to be even greater given the increase in emissions in 2017. The share of low-carbon energy sources must increase by 1.1 percentage points every year, more than five-times the growth registered in 2017. In the power sector, specifically, generation from renewable sources must increase by an average 700 TWh annually in that scenario, an 80% increase compared to the 380 TWh increase registered in 2017. Carbon Capture, Usage and Storage (CCUS) plays an important role for reducing emissions in the industry and power sectors.
Overall, the report itself is not all doom and gloom. Renewables saw the highest growth rate of any energy source in 2017, meeting a quarter of global energy demand growth last year.
- In the US The share of renewables in electricity generation reached a record level of 17%
- China contributed a lot. However, while the Chinese economy grew 7%, their emissions growth did not thankfully match that and only grew 1.7%.
China overtook the United States to become the world leader for non-hydro renewables-based electricity generation. Global solar PV capacity approached 400 GW by the end of 2017. It was an extraordinary year for solar PV additions in China, with over 50 GW of new capacity, exceeding the combined capacity additions of coal, gas and nuclear, and up from 35 GW in 2016. The new solar PV capacity added in China in 2017 alone is equivalent to the total solar PV capacity of France and Germany combined.
In the United States, 10 GW of solar PV was added in 2017, down 30% relative to 2016, but still the second- highest year on record. In India, a record 8 GW of solar PV capacity was added in 2017, double the additions seen in 2016. In the European Union wind saw a record year with 15.6 GW of capacity additions, of which 3.1 GW was offshore, also a record. With continued growth in onshore wind power, global wind capacity (onshore and offshore) reached about 510 GW.
In December 2017, China, the world’s largest heat consumer, announced a five-year clean heating plan focused on northern cities. This policy change could significantly cut the use of coal for heating and replace it with cleaner sources including renewables (biomass, geothermal and solar heat).
One Big Problem
Global fossil-fuel consumption subsidies remain high – they reached $260 billion in 2016.
We live in a low low fossil fuel priced environment and that can be an opportunity for governments to reform their subsidy policies, effectively counteracting price drops and bolstering intensity improvements. This low price environment for fossil fuels is not as such a problem, its a opportunity – hopefully enough people see that and grasp that now is the time to start eliminating the subsidies so that we can move away from our fossil fuel dependancy rapidly.
